AirLater Smoke Forecast
Quickstart
Click on the map to get a point forecast (next 48 hours), click a sensor marker to also get the last 24 hours of measured data. Change the forecast hour slider to view how the spatial forecast evolves with time. Any region without a contour is "Green" (<50 AQI). Click the toggle to switch the map contours between HRRR forecast (government physical model) and the AirLater forecast (machine learning correction to HRRR using real time data).
Introduction
The AirLater forecast was developed to make significant improvements to existing smoke forecast tools. Specifically, some issues we were trying to solve-
-
The currently best available smoke forecasts (such as HRRR) do not have an easy way to obtain a quantitative point forecast (a forecast for how the AQI will evolve in the next 48 hours at a specific location)
-
Current best forecasts do not adapt to real time data; often even the time-zero forecast (forecast for what is happening right now) is significantly off
-
Government sponsored air quality monitoring sites (such as airnow.gov) lack accurate visualizations (contours based on sparse data can be misleading)
Origins
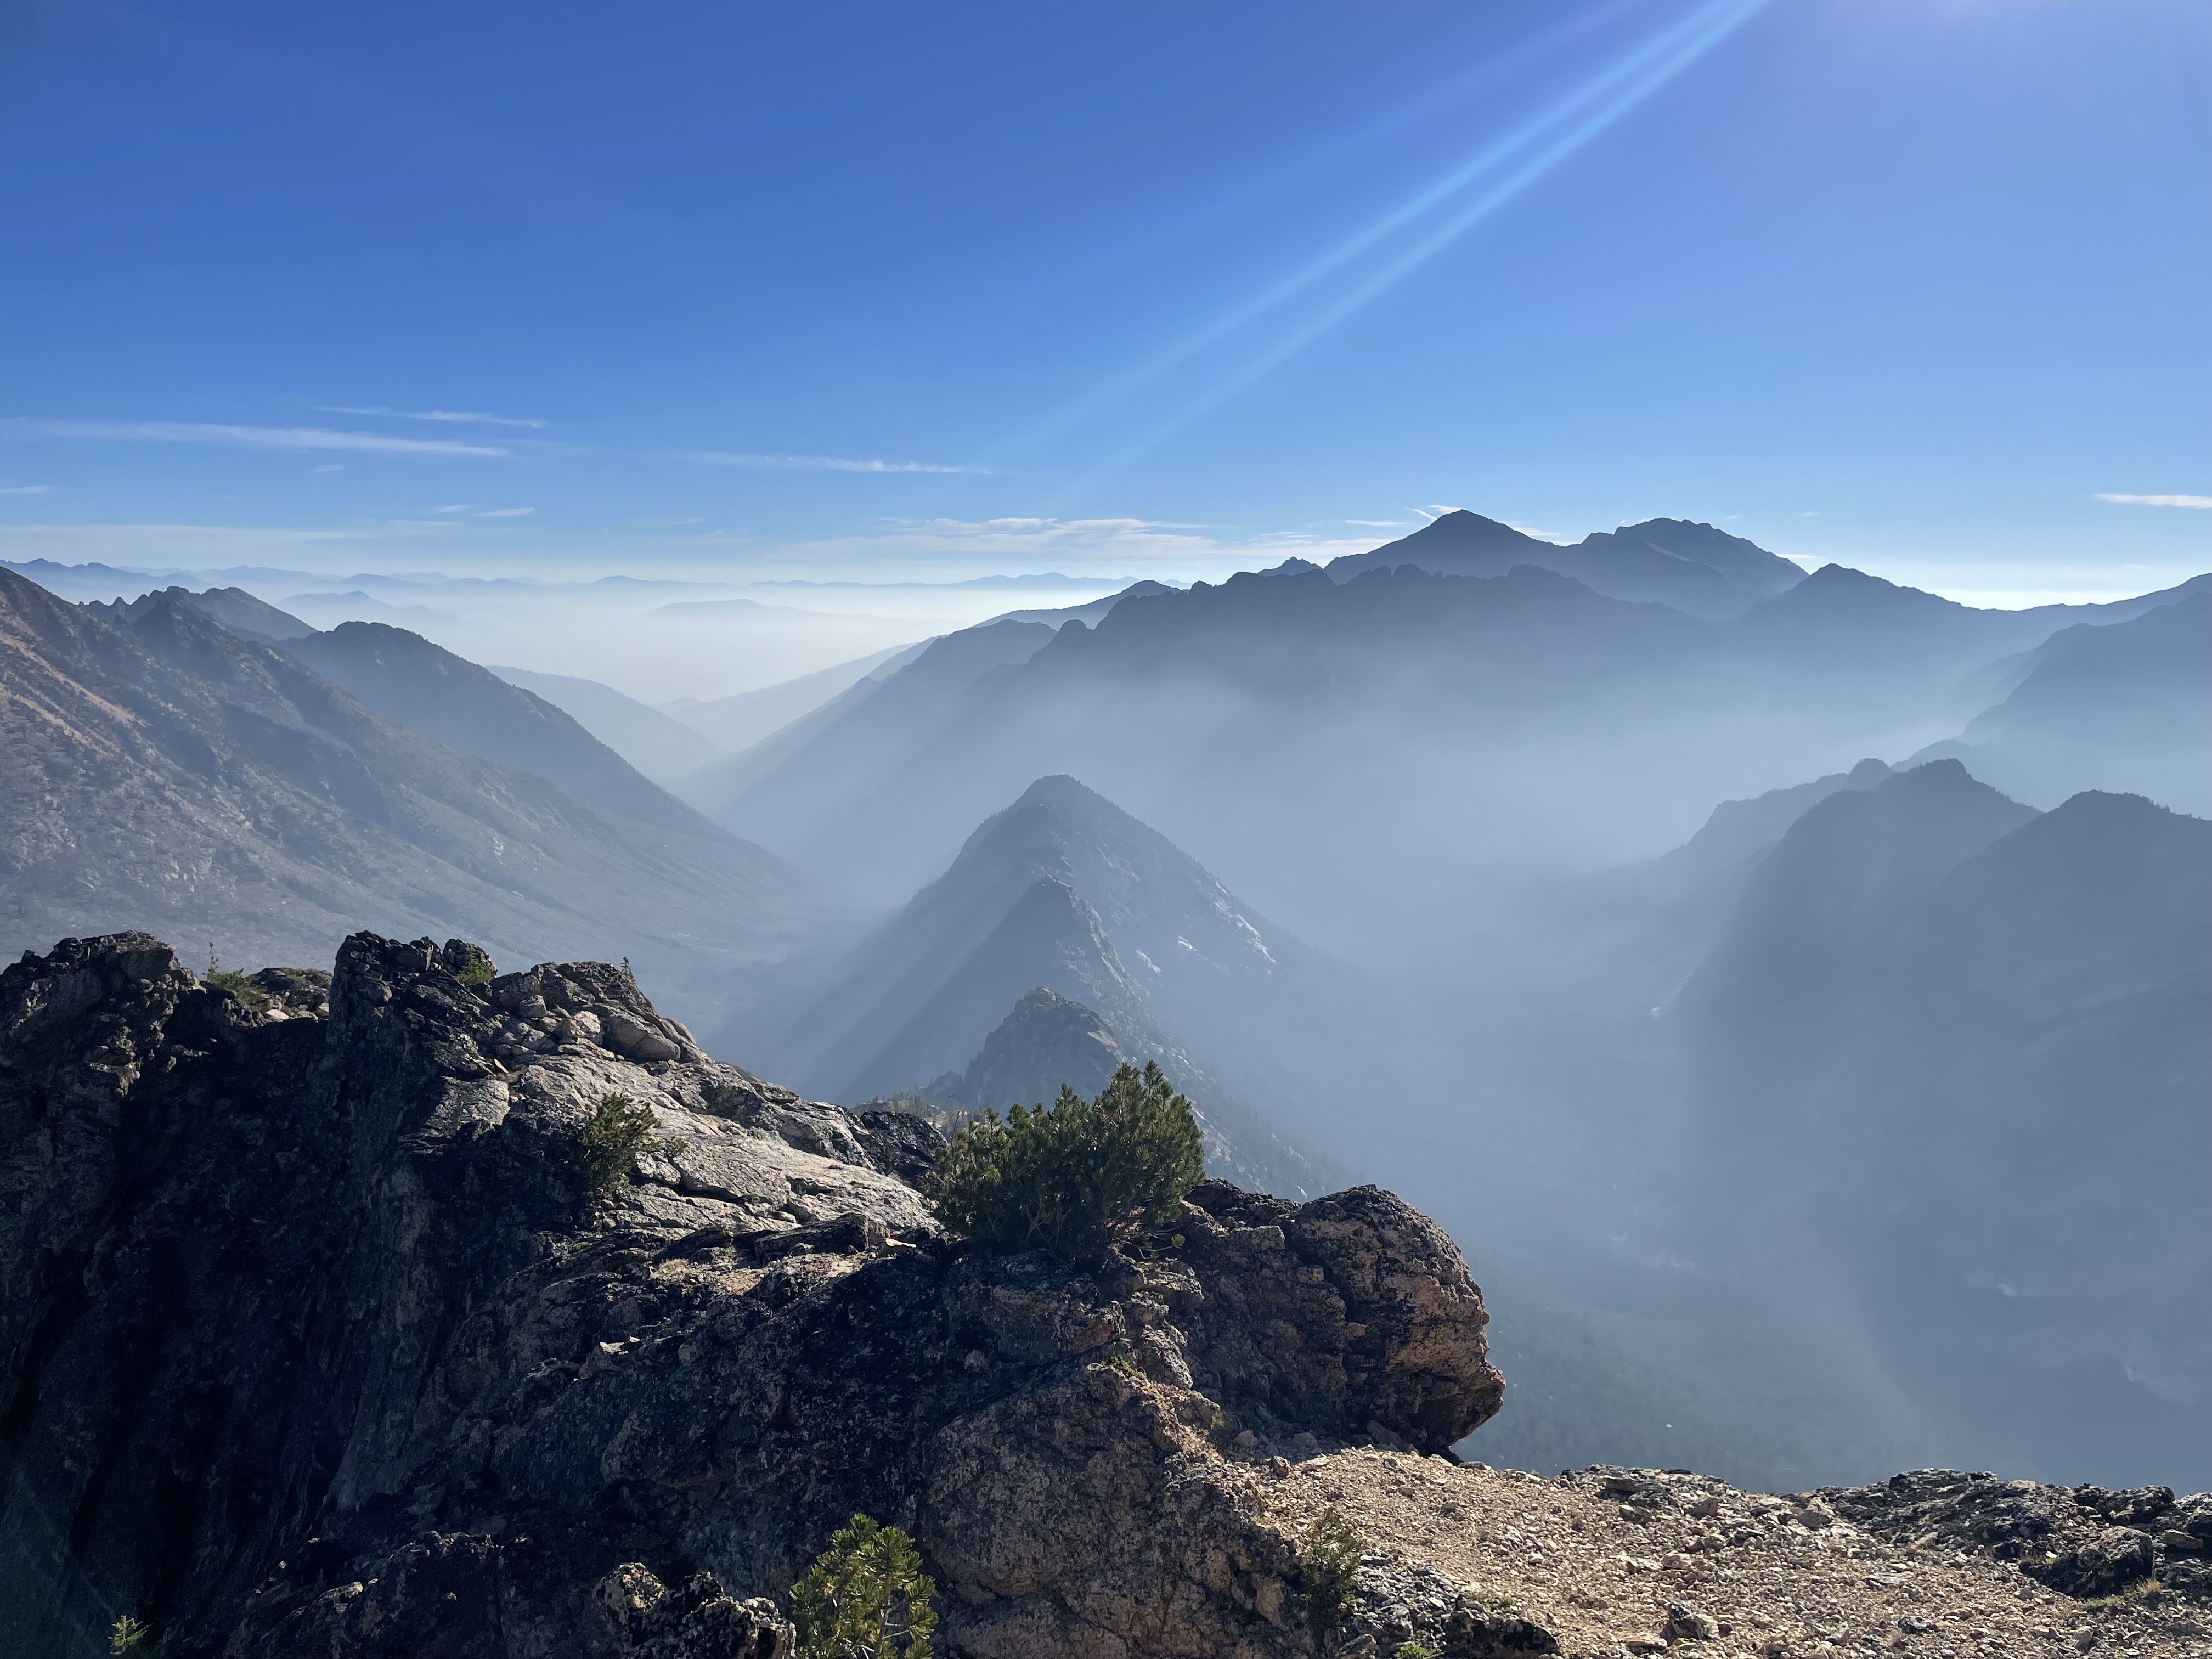
In August 2022, I went camping near Mazama, WA with some friends and family, including my 9 month old daughter. I was particularly concerned about air quality for her little lungs so set up a python script to send the quantitative HRRR forecast to my inReach satellite text device. One morning I went for a quick run up Wallaby peak with legendary local athlete Lance Biggers, and despite the HRRR forecast predicting <10 AQI for the next 48 hours we could see smoke with our own eyes, and furthermore the real time sensors in Winthrop were picking up 50-150 AQI levels. We decided to pivot to the west side of the mountains for cleaner air, but this incident stuck with me - why can't real time data be used to improve the smoke forecast?
HRRR Forecast wrapping
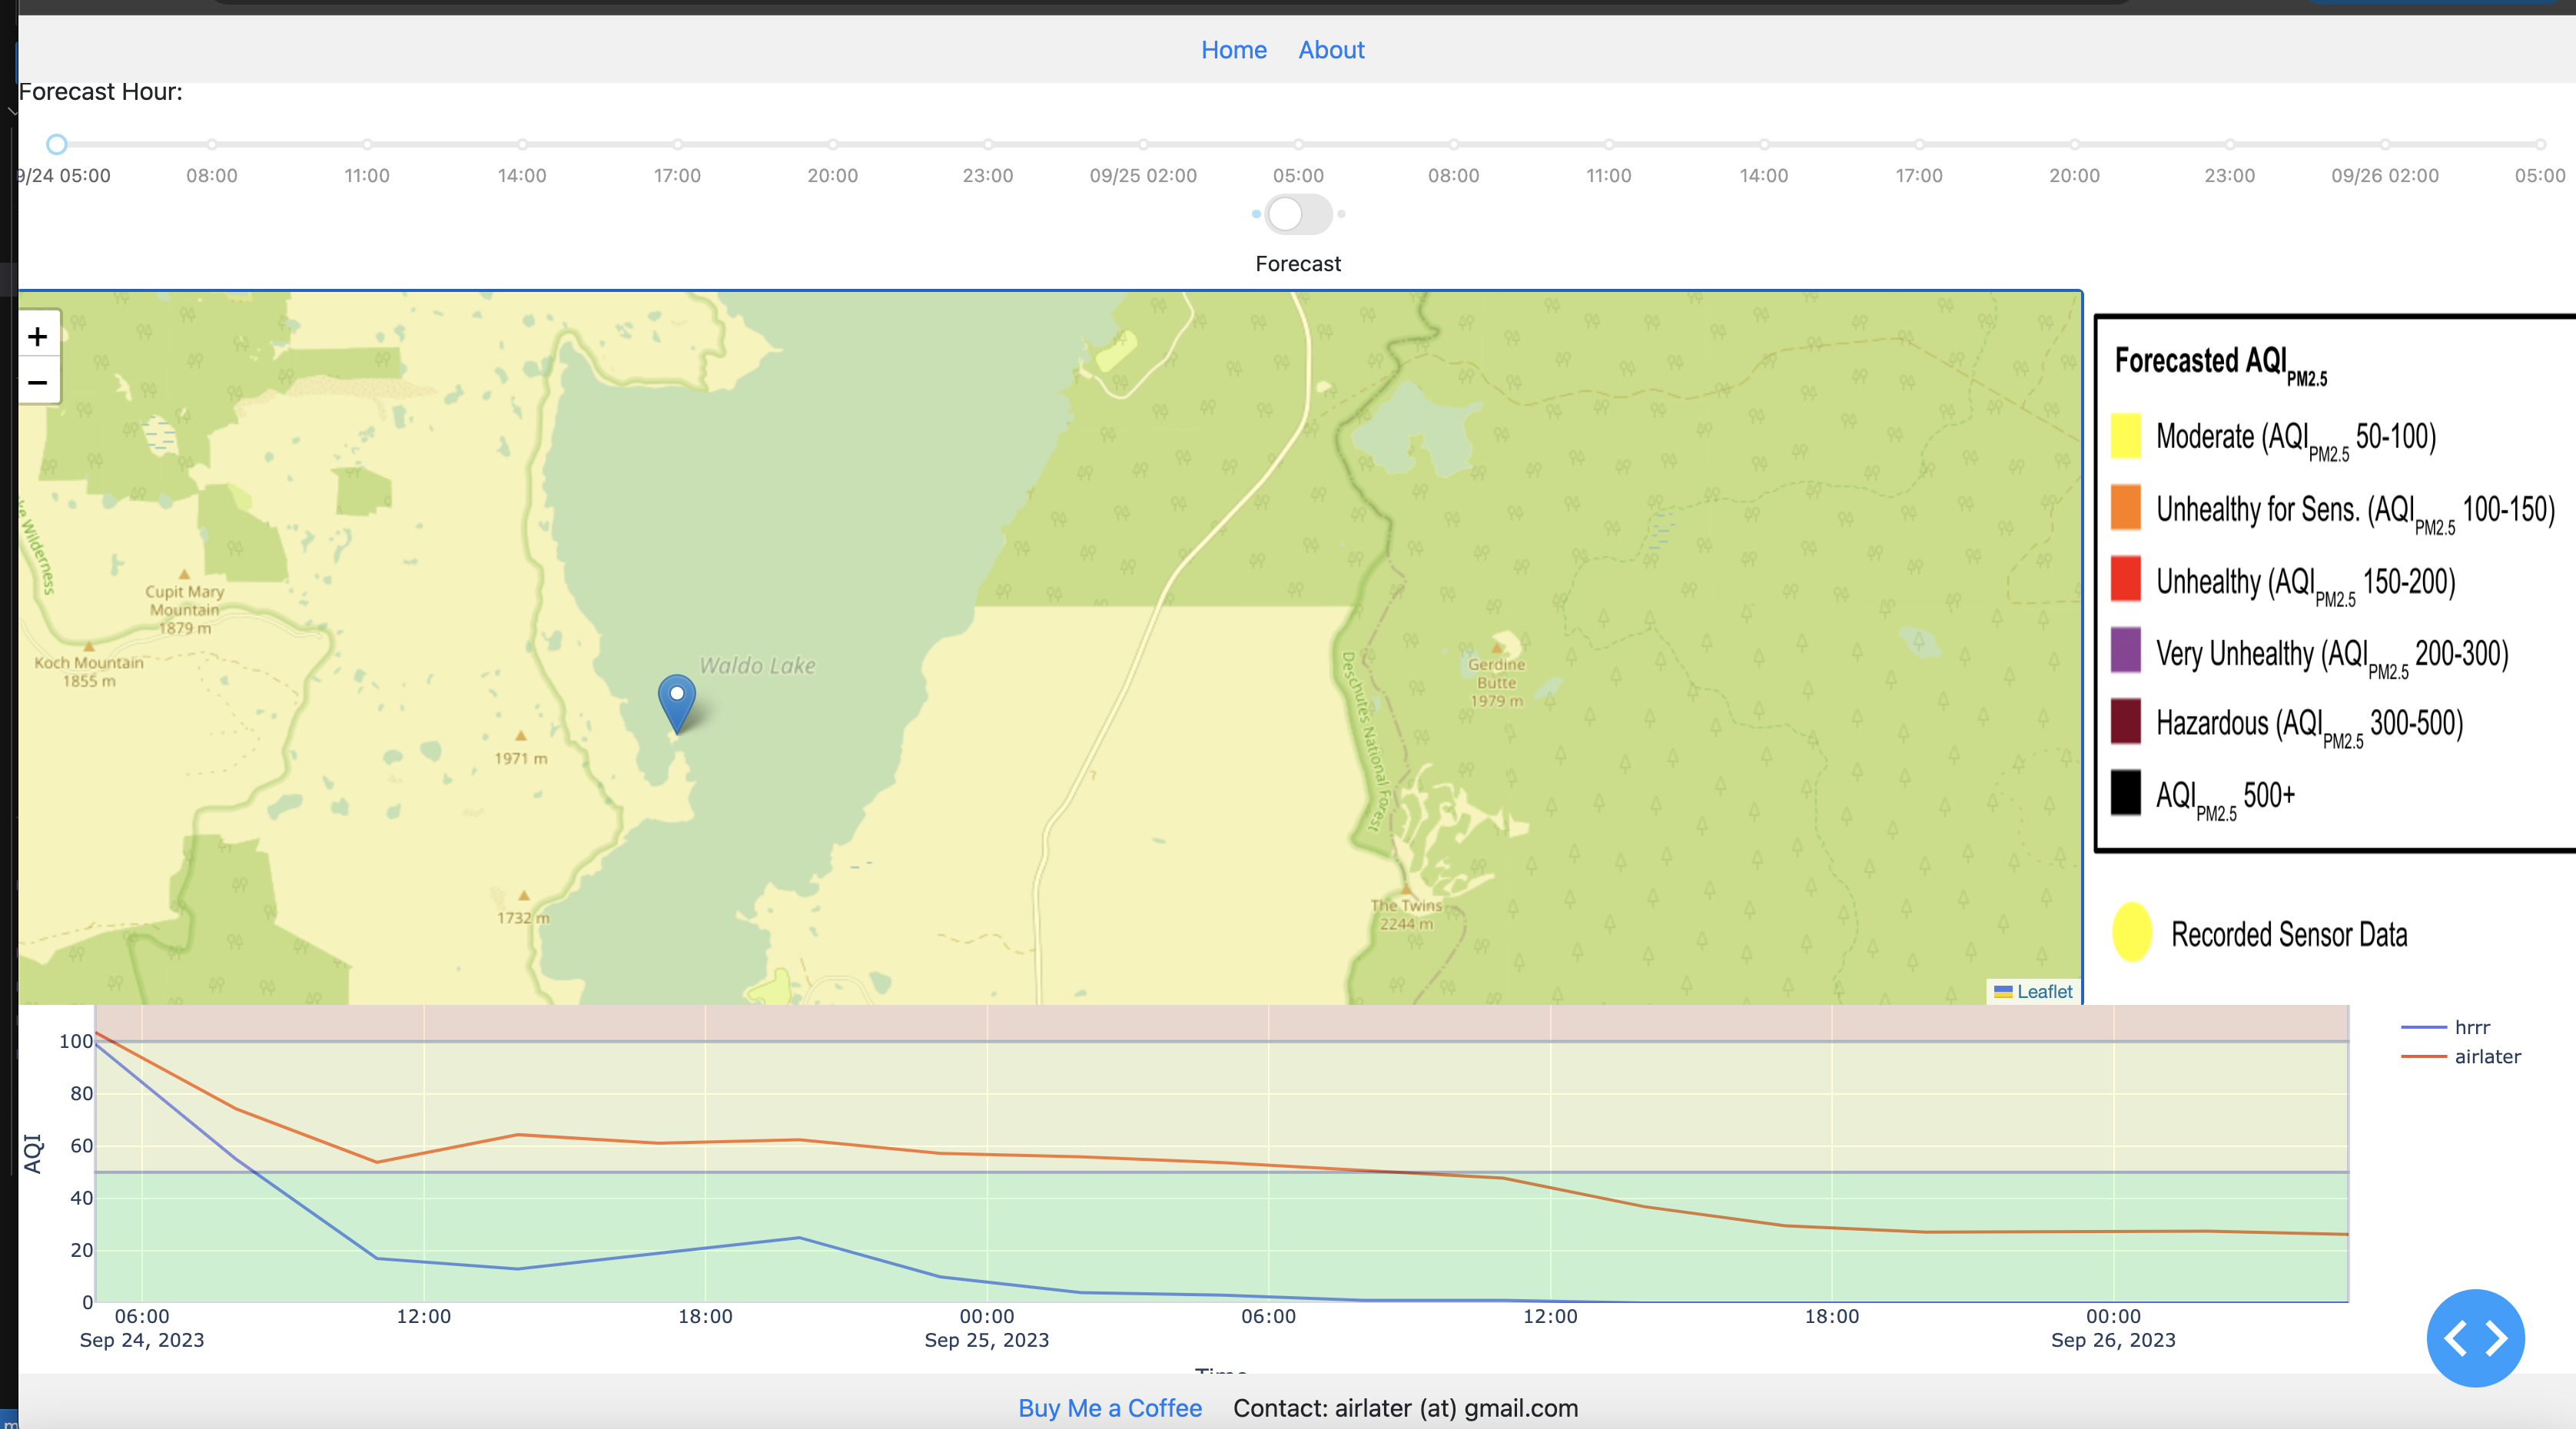
The primary objective of this project is to provide the HRRR data in a more user friendly format. Currently, to get the HRRR forecast, one has to go to the website, find one of the times that is actually a 48hr (not 12hr) forecast, convert times from UTC to PDT, then look at a visualization which only shows county lines. It is very tedious to get a quantitative point forecast for a location of interest. The default model (contour layer) shown here is the HRRR model, hopefully presented in a relatively useful way (just click anywhere to get point smoke forecast). In the AirLater map, the default forecast is simply the HRRR forecast, and the contours on the map are the AQI from PM2.5 contribution based on HRRR forecast (no contour over a region means "green" or AQI < 50). To get a quantitative point forecast, click anywhere to get a 48 hr forecast at that location (see below left example for point forecast on Waldo lake). Additionally, click on a circle marker (denoting EPA sponsored sensors) to view the measured AQI from the last 24 hours along with forecast for next 48 hours. See below for a description of the "AirLater" forecast line.
AirLater Forecast
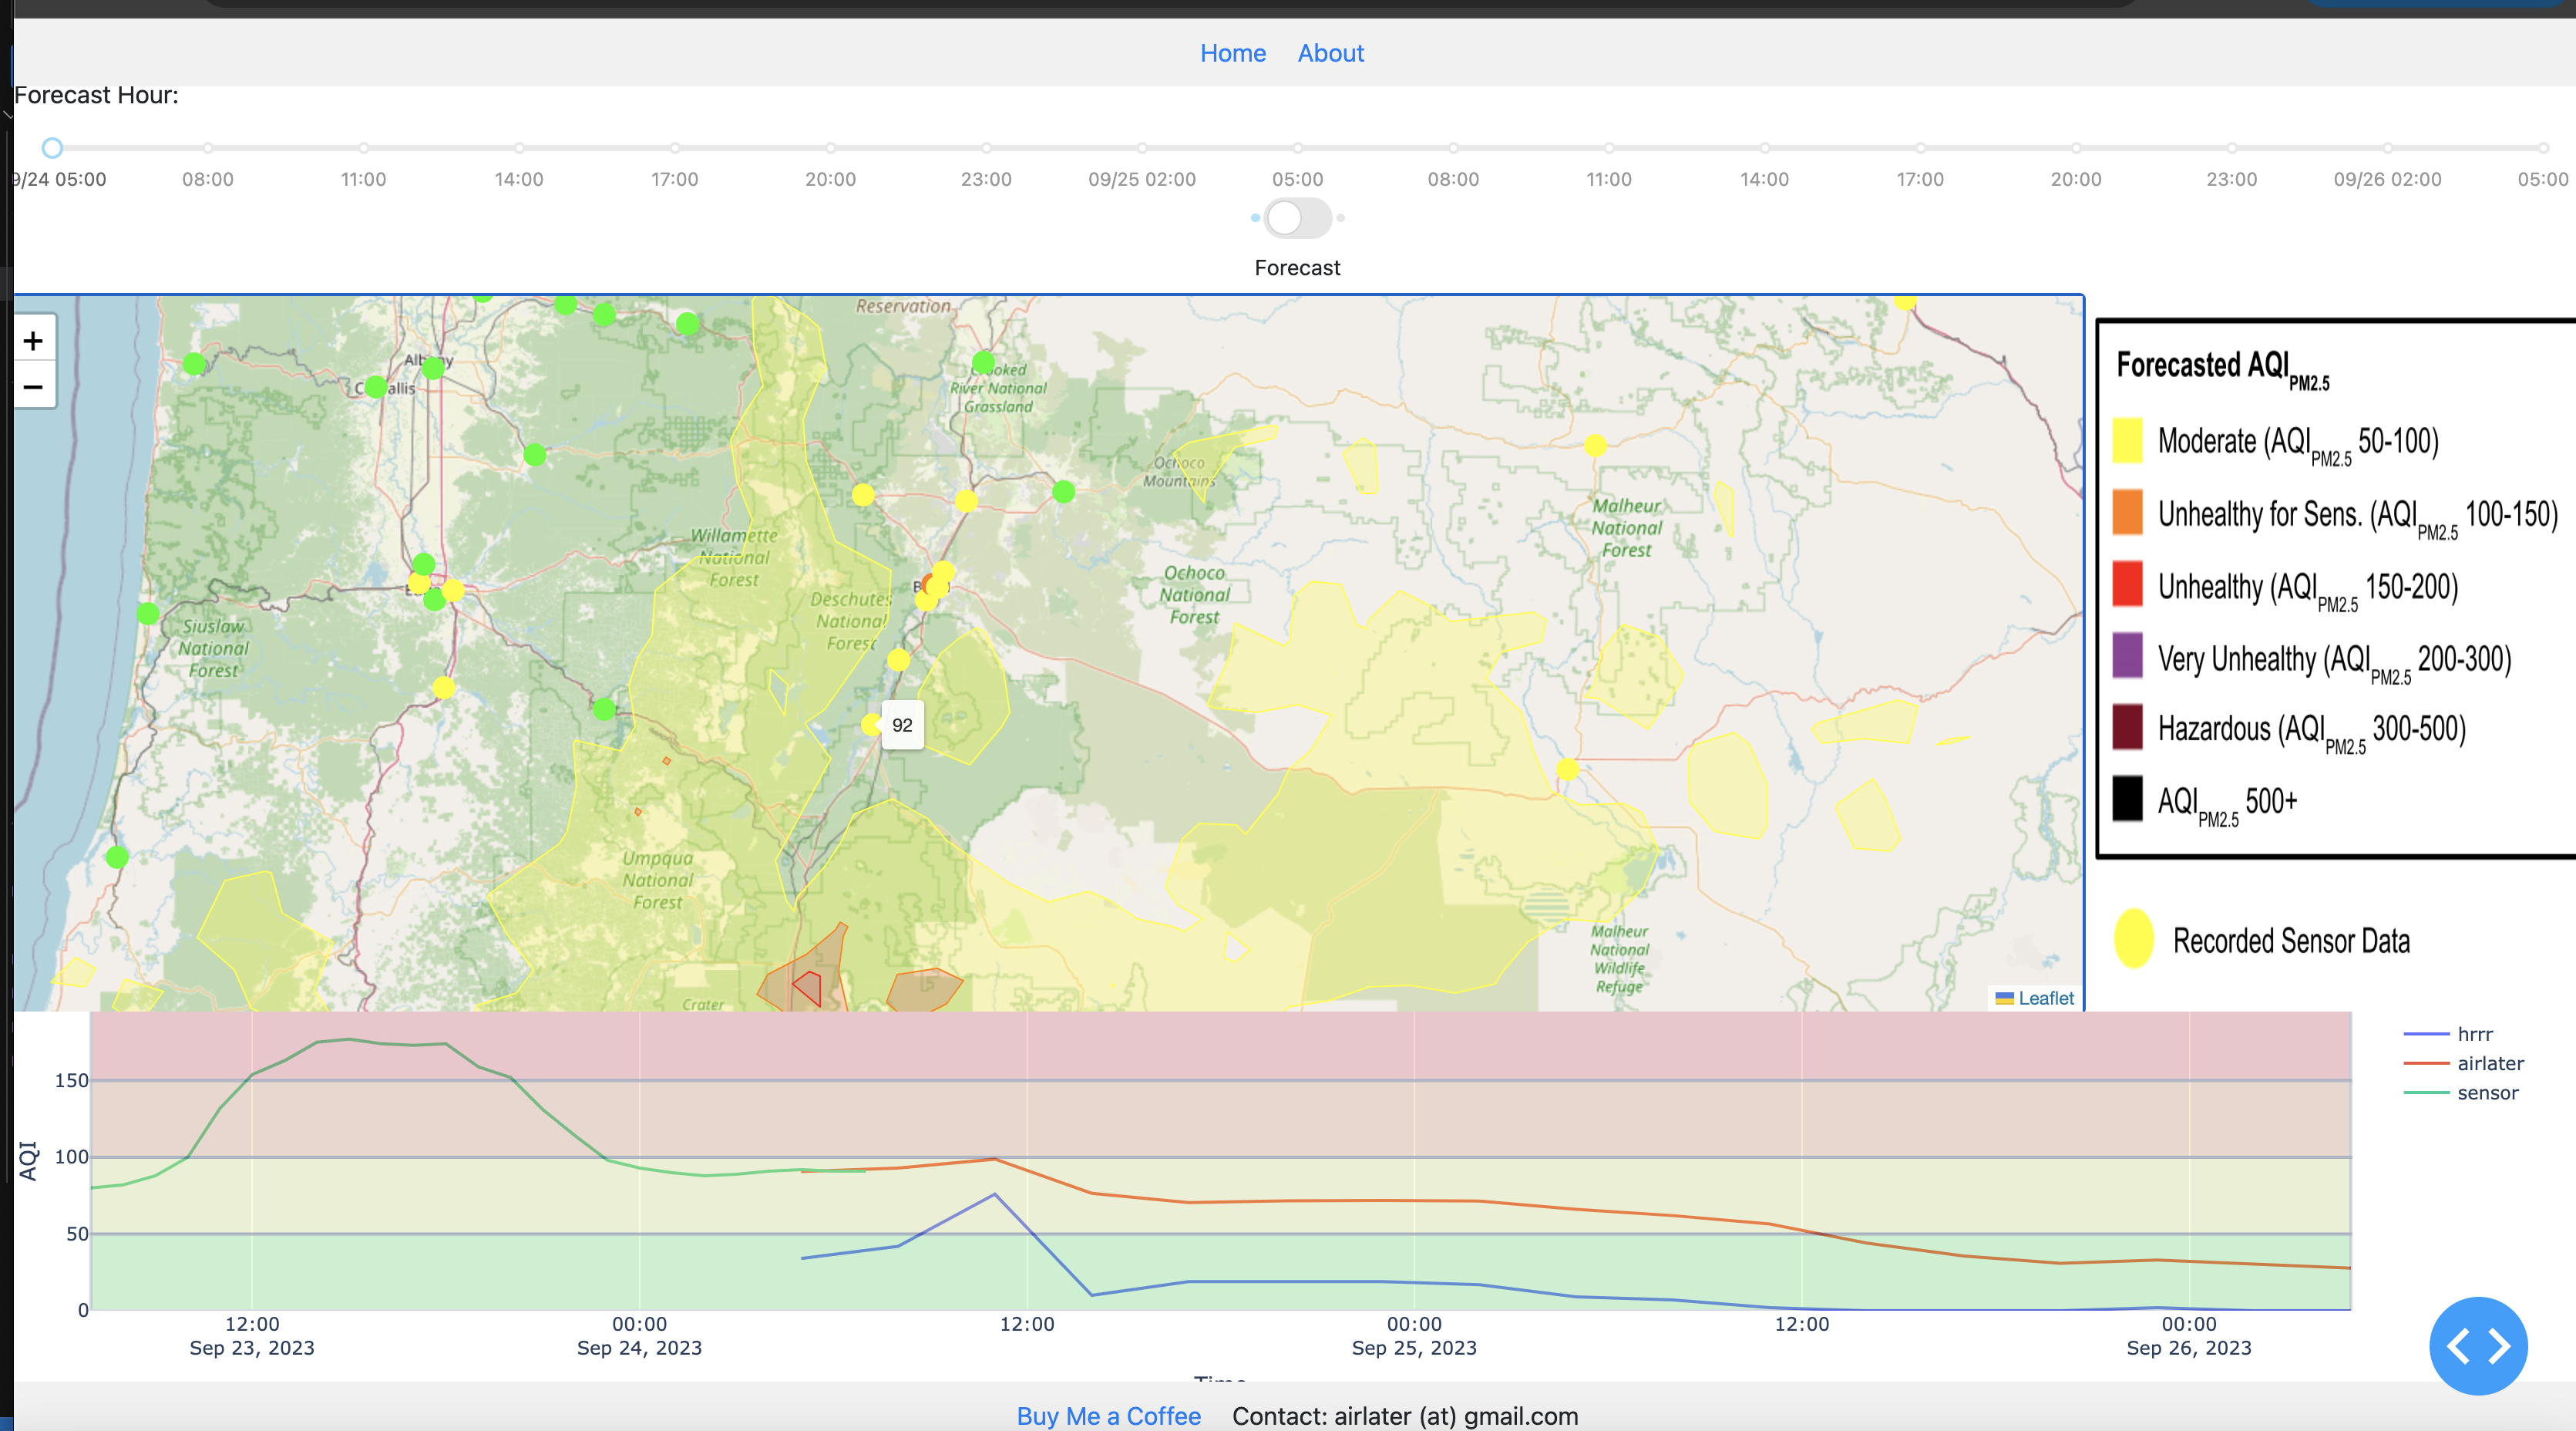
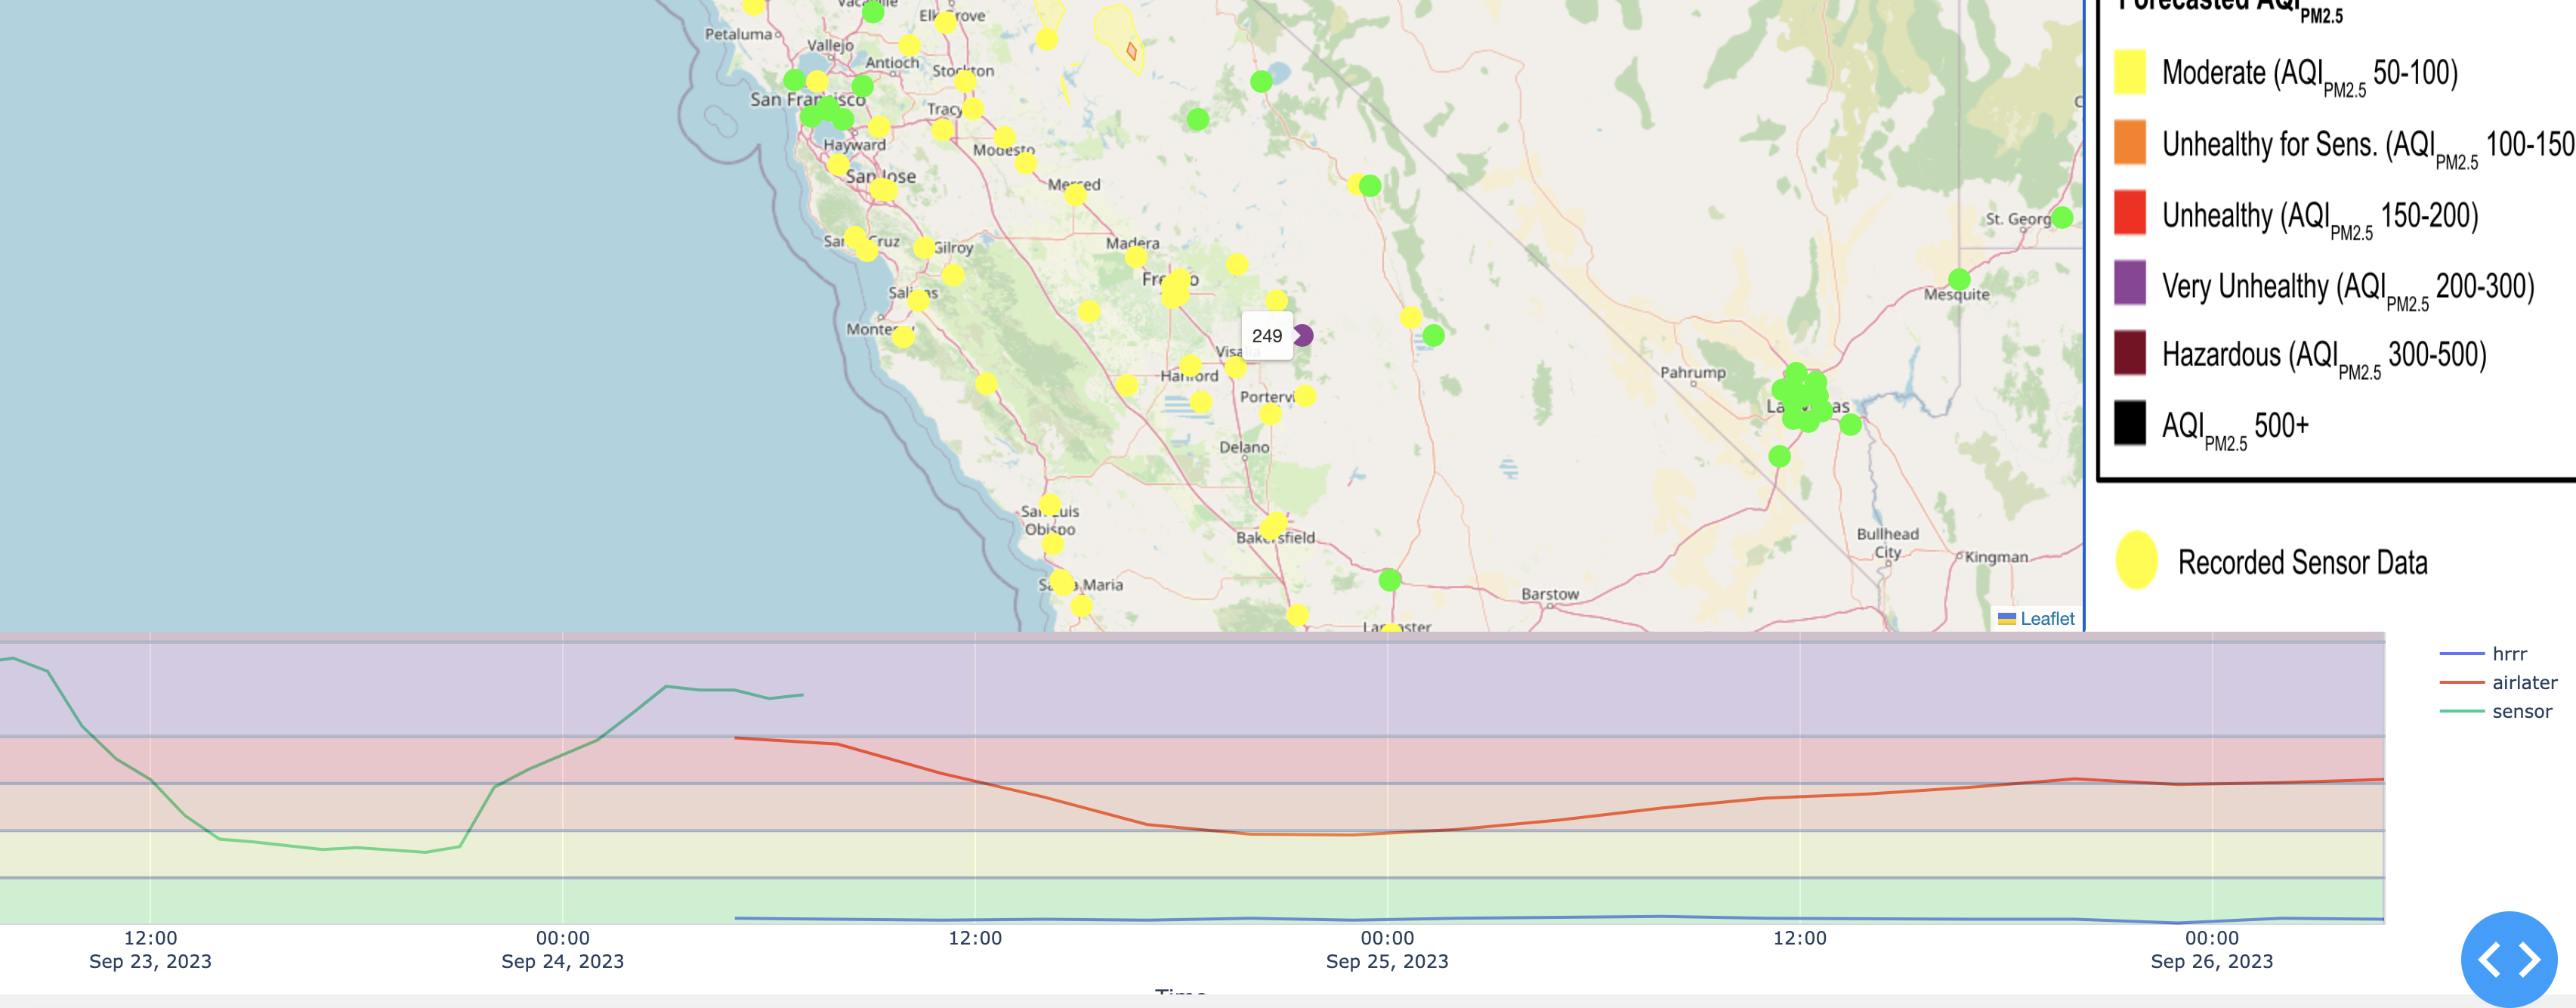
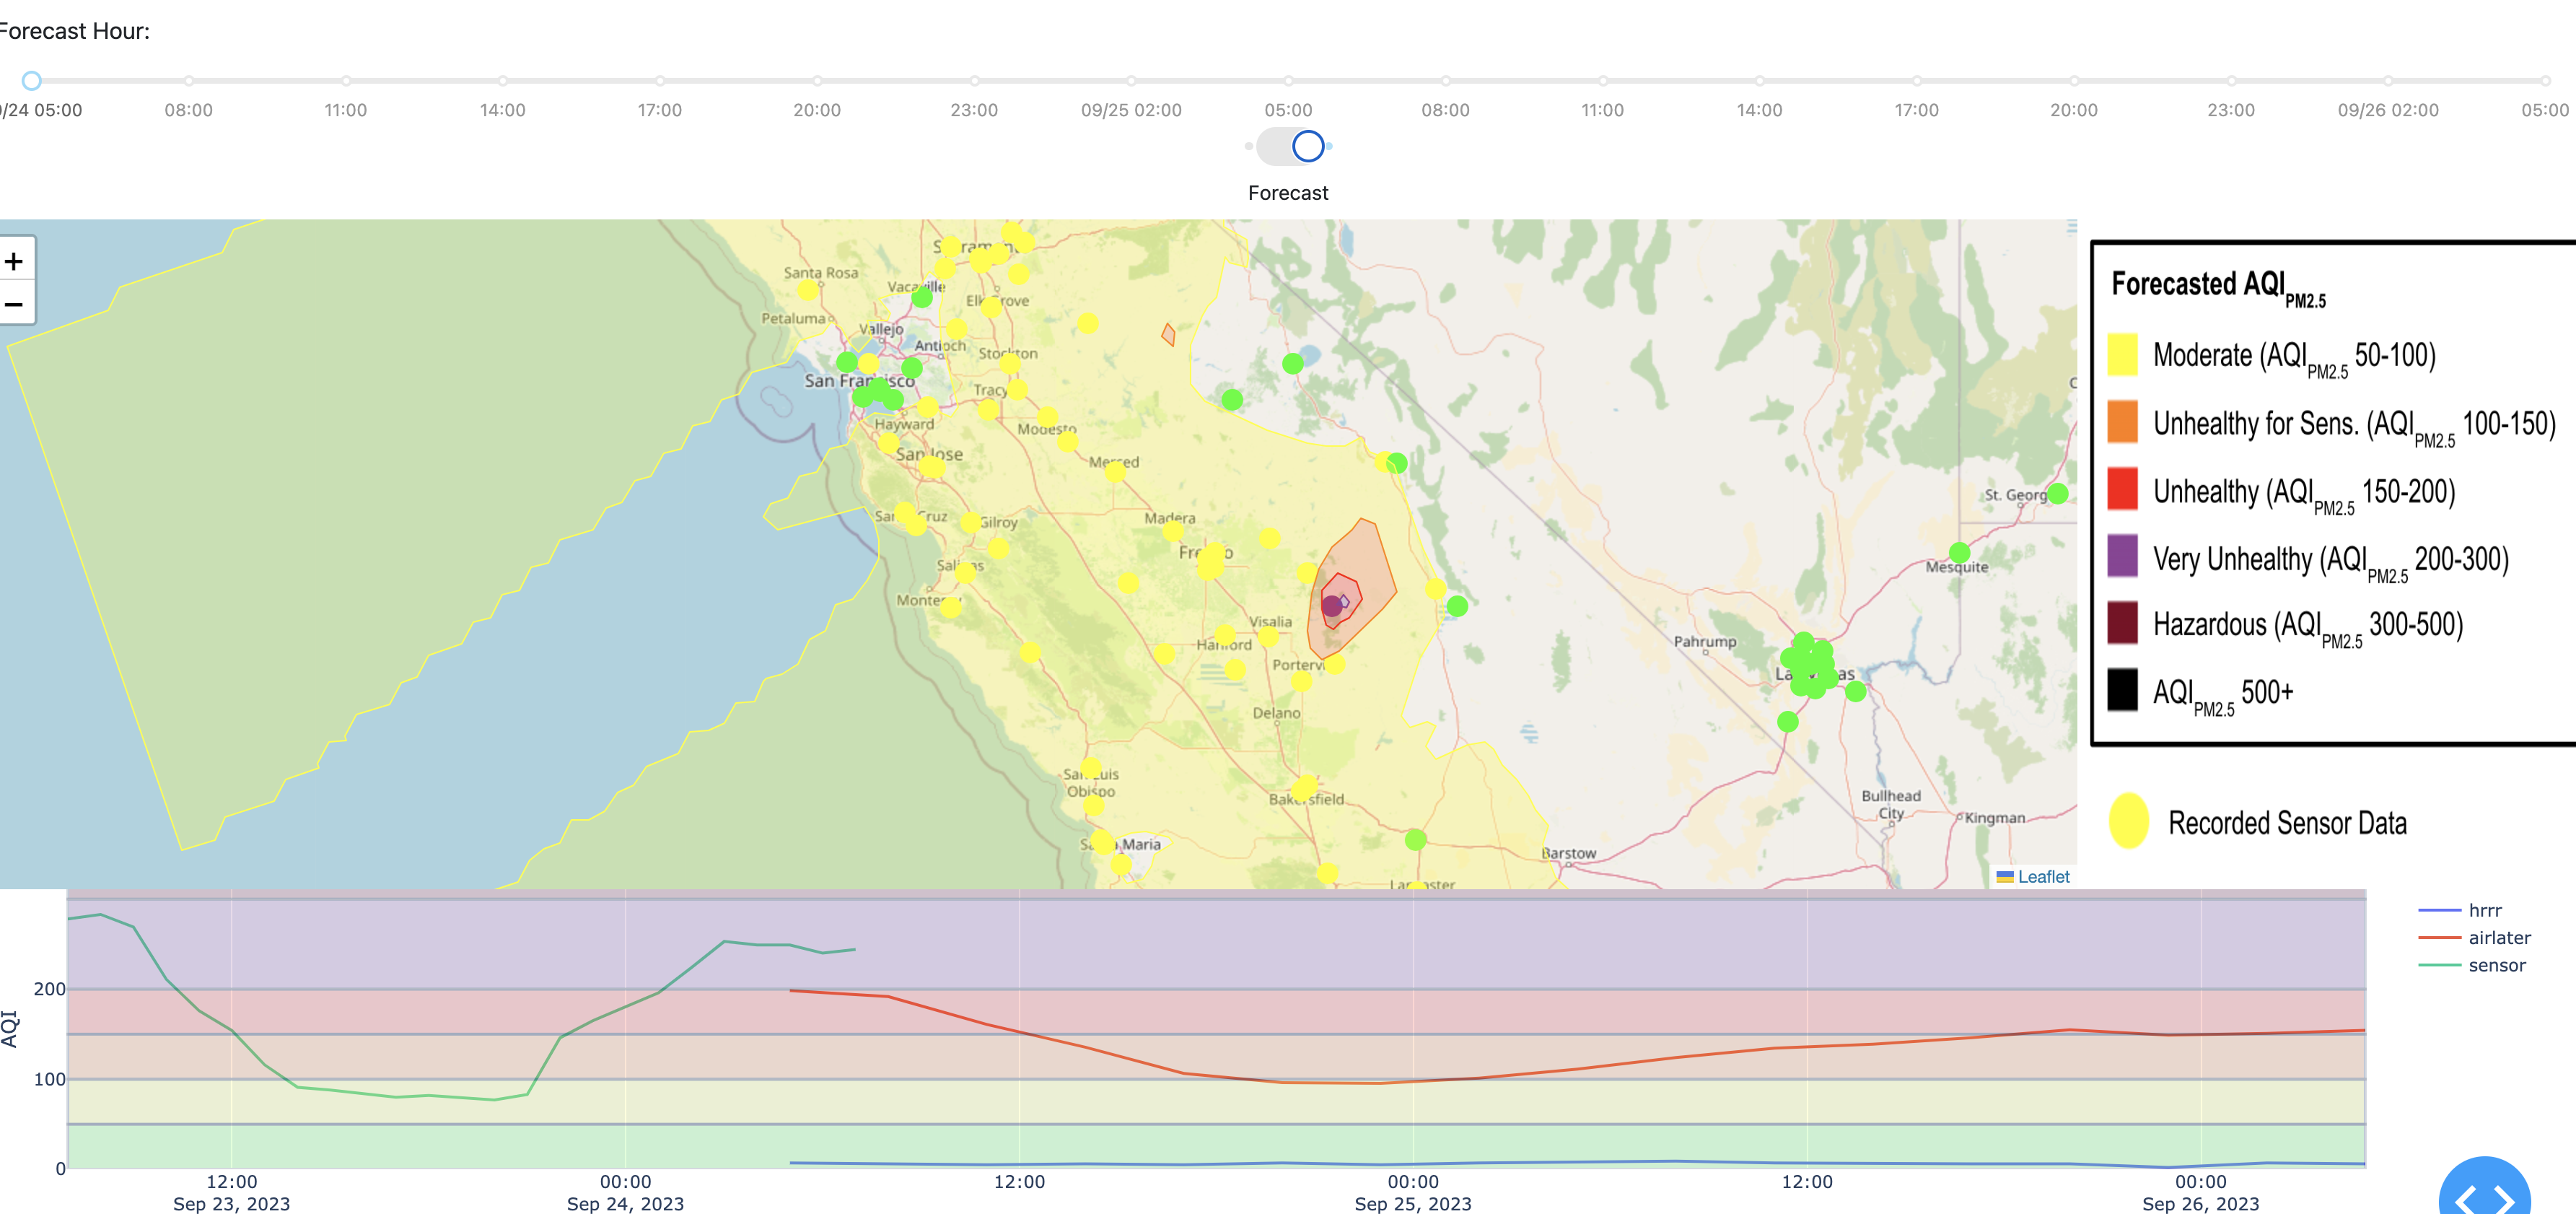
A secondary objective is an experimental project to use machine learning to improve upon the HRRR smoke forecast with real time data. I input the HRRR forecast as well as recent sensor data where sensor data is available, then based on a historical training dataset I present a modified 48 hour forecast. Consider the anecdote below - there is real time data showing substantial smoke from the Summit fire flare up near Sequoia National Park, CA in August 2022, which is demonstrated by one high sensor reading close to the fire and additional moderate sensor readings in the surounding area. However, the HRRR forecast is not predicting this smoke event, and does not adapt to real time data, so the HRRR predictions for the next 48 hours are all close to 0 for the entire region (see lack of contours below left, indicated entire region predicted <50 AQI). Instead, the AirLater forecast is influenced by the real time sensors in the area, and predicts elevating upcoming air quality (see AirLater contours below right).
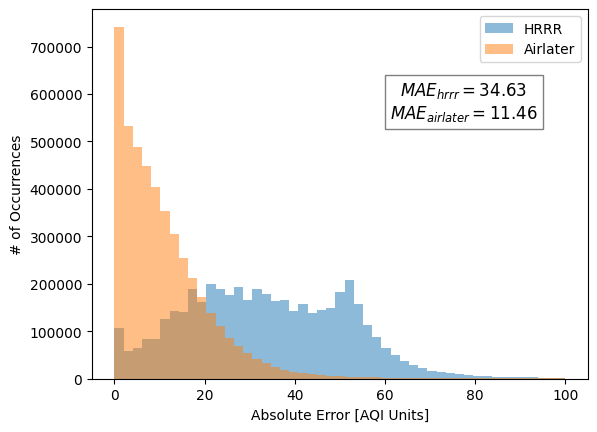
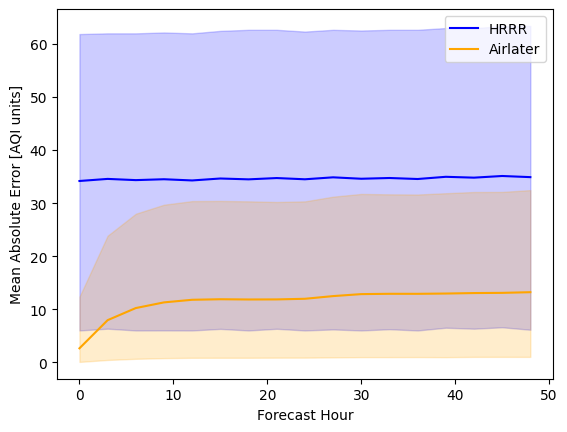
I evaluated our model on a holdout validation set from the historical dataset (holdout means data not used for training), where the forecast was generated using only past data and the forecast was evaluated using the actual sensor readings realized at sensor sites over the next 48 hours. I found generally superior quantitative performance on predicting PM2.5 contribution to AQI than the HRRR model alone. Below left shows the distribution of errors for the HRRR vs AirLater forecasts for the validation set, aggregated over forecast hour (forecasts for hours 0-48 all lumped together). The headline takeaway is that the AirLater forecast has a mean absolute error that is one third of the HRRR alone, which is a significant improvement. Note that the histogram is cutoff at 100 AQI units, but there is a long tail for both forecasts that go much higher for extreme smoke events. The below right plot shows the error broken down by forecast hour, for each forecast the mean (line) and 5th - 95th percentile error range (shaded region) is presented. Note that the AirLater forecast has a stronger impact on forecast hour because of its ability to leverage recent sensor data in its prediction.
How to interpret AirLater forecast
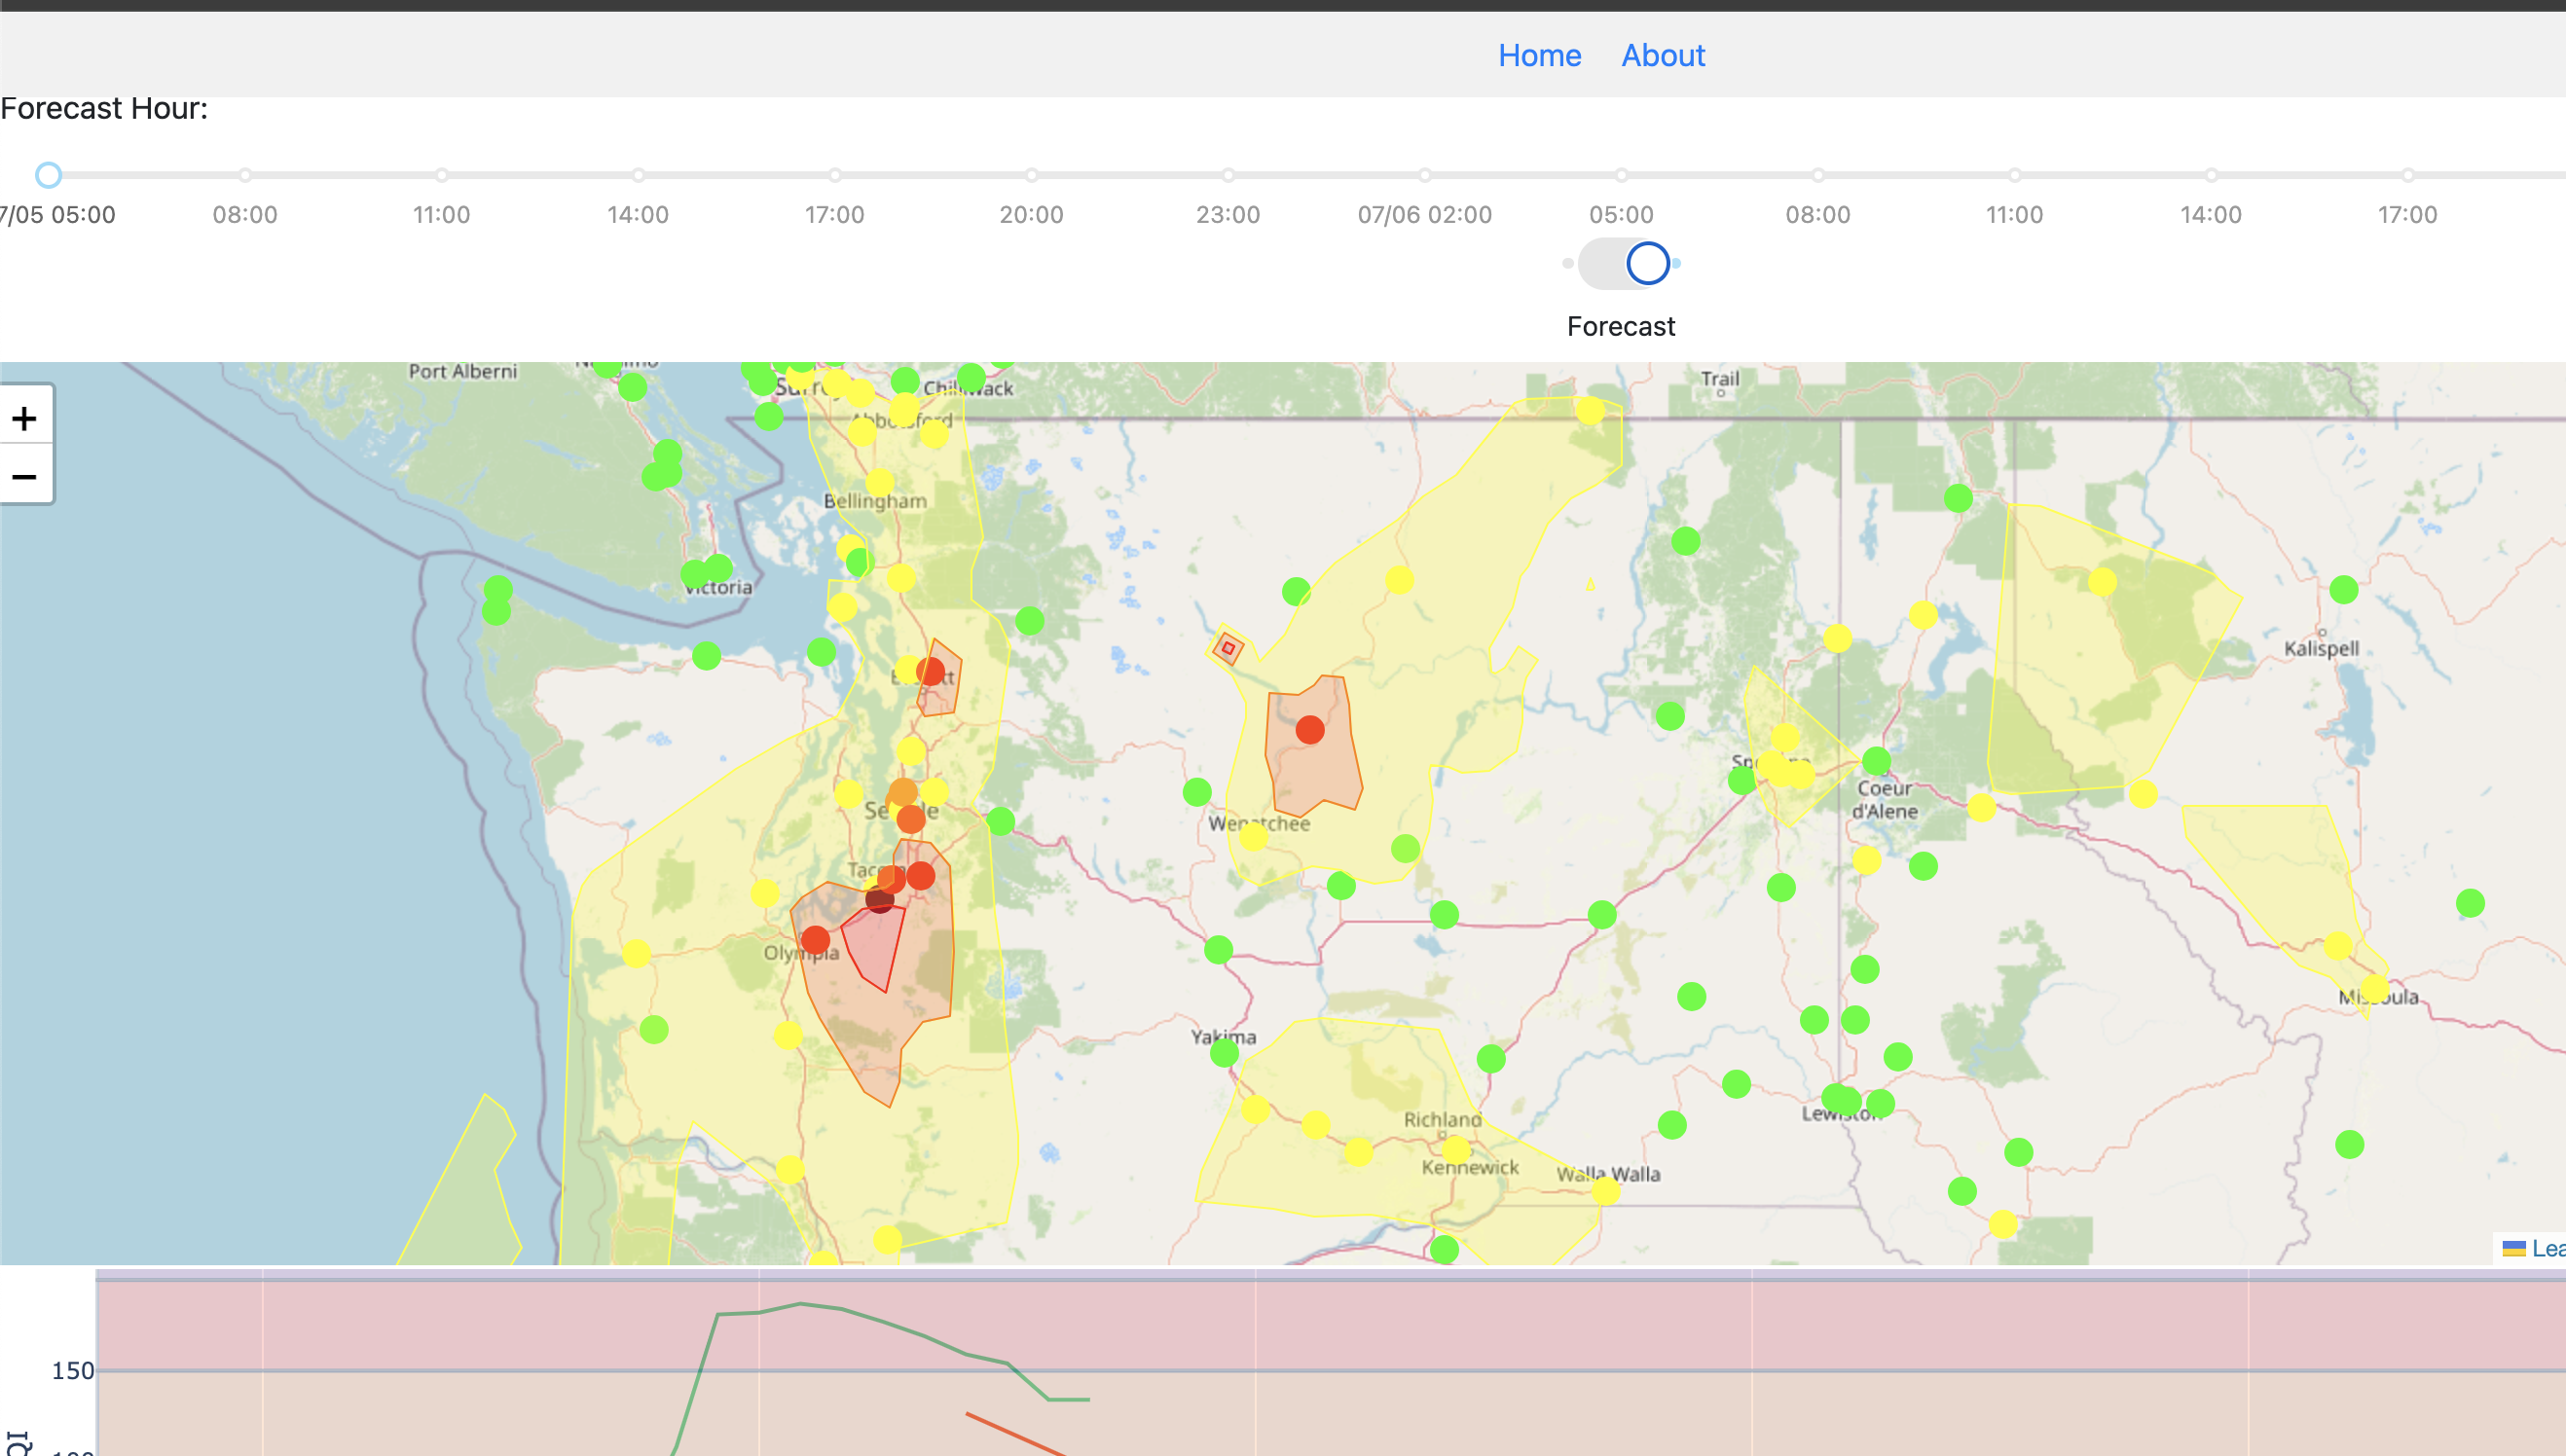
First, note that the AirLater forecast is modeling the contribution of all PM2.5 sources to AQI, while the HRRR model is only modeling contributions from smoke. One example that clearly illustrates this is looking at the time zero forecast for the morning of July 5th, 2024 where a night of fireworks combined with a start of a heat wave caused elevated PM2.5 pollution in the Seattle area (this is modeled by AirLater forecast but not by HRRR).
This difference should be noted, but critically it is typically total pollution level and Air quality that should be considered when making decisions about outdoor activities. Smoke forecasting is inherently challenging, and dynamic events (especially new fires) can create substantial errors in the predicted smoke levels. Please note that the AirLater forecast is experimental and under development. Note that in locations far away from EPA real time sensors, and in the further time horizon forecast (24-48 hrs) the performance of the AirLater forecast reduces more closely to just the HRRR performance. Also note that we model only the PM2.5 contributions to AQI, the PM10 or Ozone contributions are ignored (so AQI could be higher than we predict)
Forecast 2 Inreach
AirLater can send you an updated smoke forecast to your inreach in the field, which can be very useful when doing overnight trips in the backcountry. To get an updated forecast, just send an email with your inreach to "airlater.update (at) gmail.com" and you will get a reply with a point forecast at your location. They body of the text message doesn't matter, but you need to ensure that your message includes reply link and location (you may need to enable location services for Earthmate app if sending from smartphone, or you may need to "wait for GPS" if sending directly from device). See below for an example respose
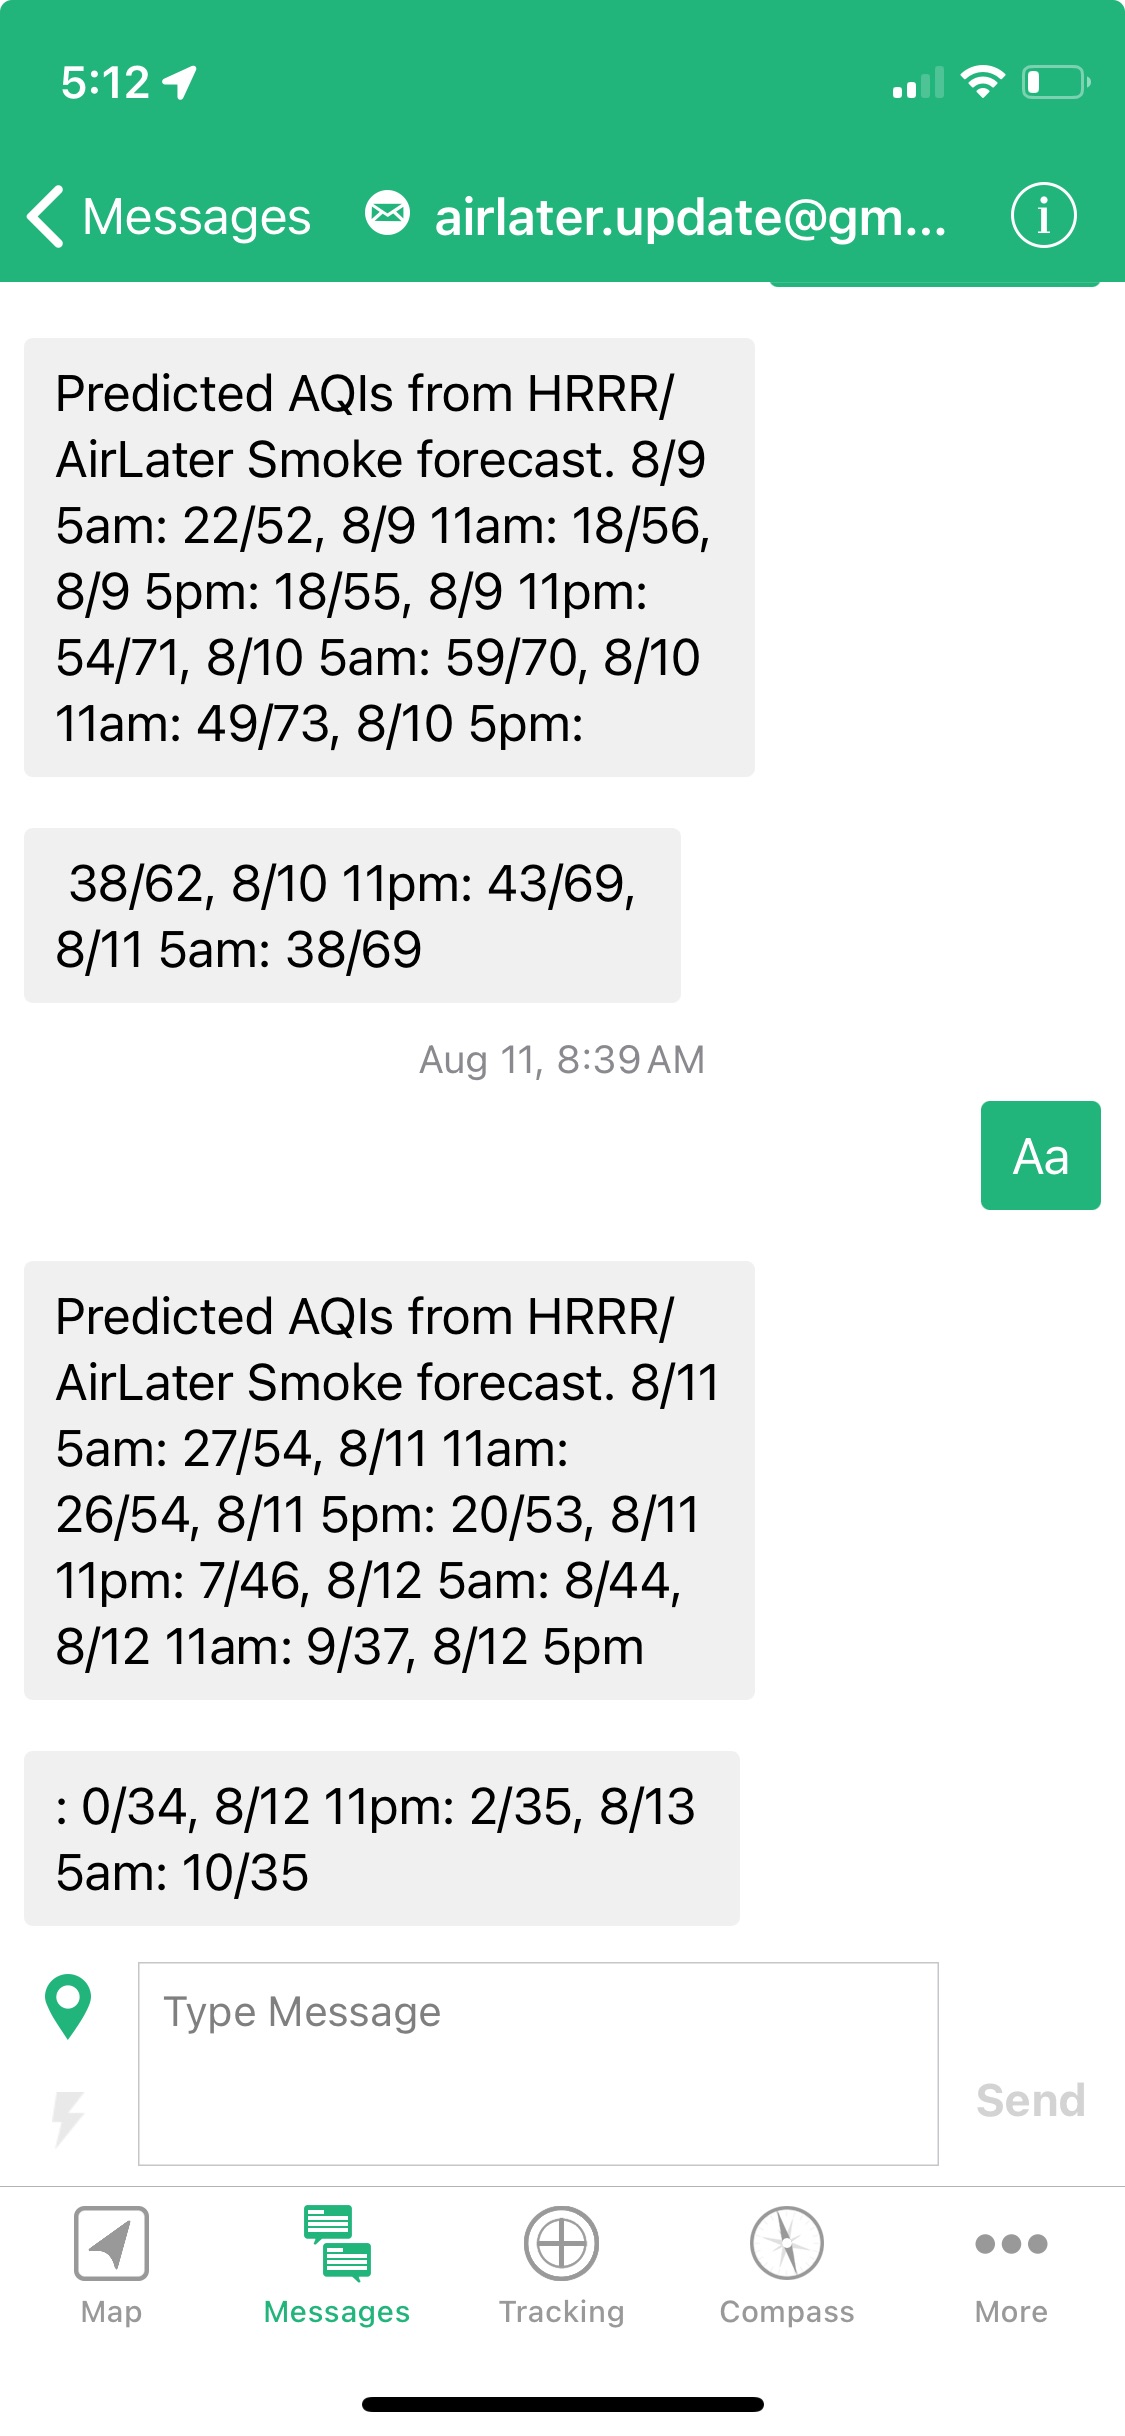
The HRRR and AirLater forecasts are both included, so "8/9 5am: 22/52" means that on August 9th at 5am, the AQI is forecasted to be 22 (according to HRRR) and 52 (according to AirLater). Note that the forecast is udated 4 times a day at around 1:40am, 7:40am, 1:40pm, and 7:40pm; so request a forecast shortly after those times for the most updated forecast. Finally, this is for informational purposes only, and please note that the forecast is often quite off in the case of new fires. If you are in the backcountry and suspect a new fire nearby, please use your inreach to text a human in the front country to advise on the saftey of your situation.
Future work
I am constantly striving to improve the AirLater forecast and app. My primary near term objectives are to (a) improve usability and visualizations of the app and (b) improve the quantitative AirLater forecast. The machine learning problem formulation is non-trivial - we are predicting a function that is a function of time and space (contiguous US for 48 hr time horizon), but training data is discrete (only at locations with sensor data). I have conducted some experiments on various model formulations and use these results to influence the current production model, but further model refinement could significantly boost performance. Probably the biggest improvement in model performance could be realized through inclusion of a larger dataset of real time sensors - in this version I only included EPA sponsored sensors which are more accurate and reliable. Including a wider sensor network (such as from Purple Air) would substantially improve data we have for correction and improve model accuracy, yet would require considerable data ingestion and cleaning/reliability efforts. Finally, as the HRRR production dataset only goes back to 2020 the training dataset is relatively small - as the time goes forward and more dynamic smoke events are recorded the AirLater model will continually improve.
Each of these improvements takes time, and also there is a cost associated with hosting, servers, and compute to support the AirLater forecast. If this app provides any value to you, or you would like to see some of this Future work realized, please consider supporting via the Buy Me a Coffee link below. Also, if you have any feedback or questions please contact me at the link below.